
Mapped paddocks
Draw each boundary once. Area is calculated, colours are yours, and every soil and compaction reading lands in the right place.
The platform
 7indicators per sample
Part one — the probe
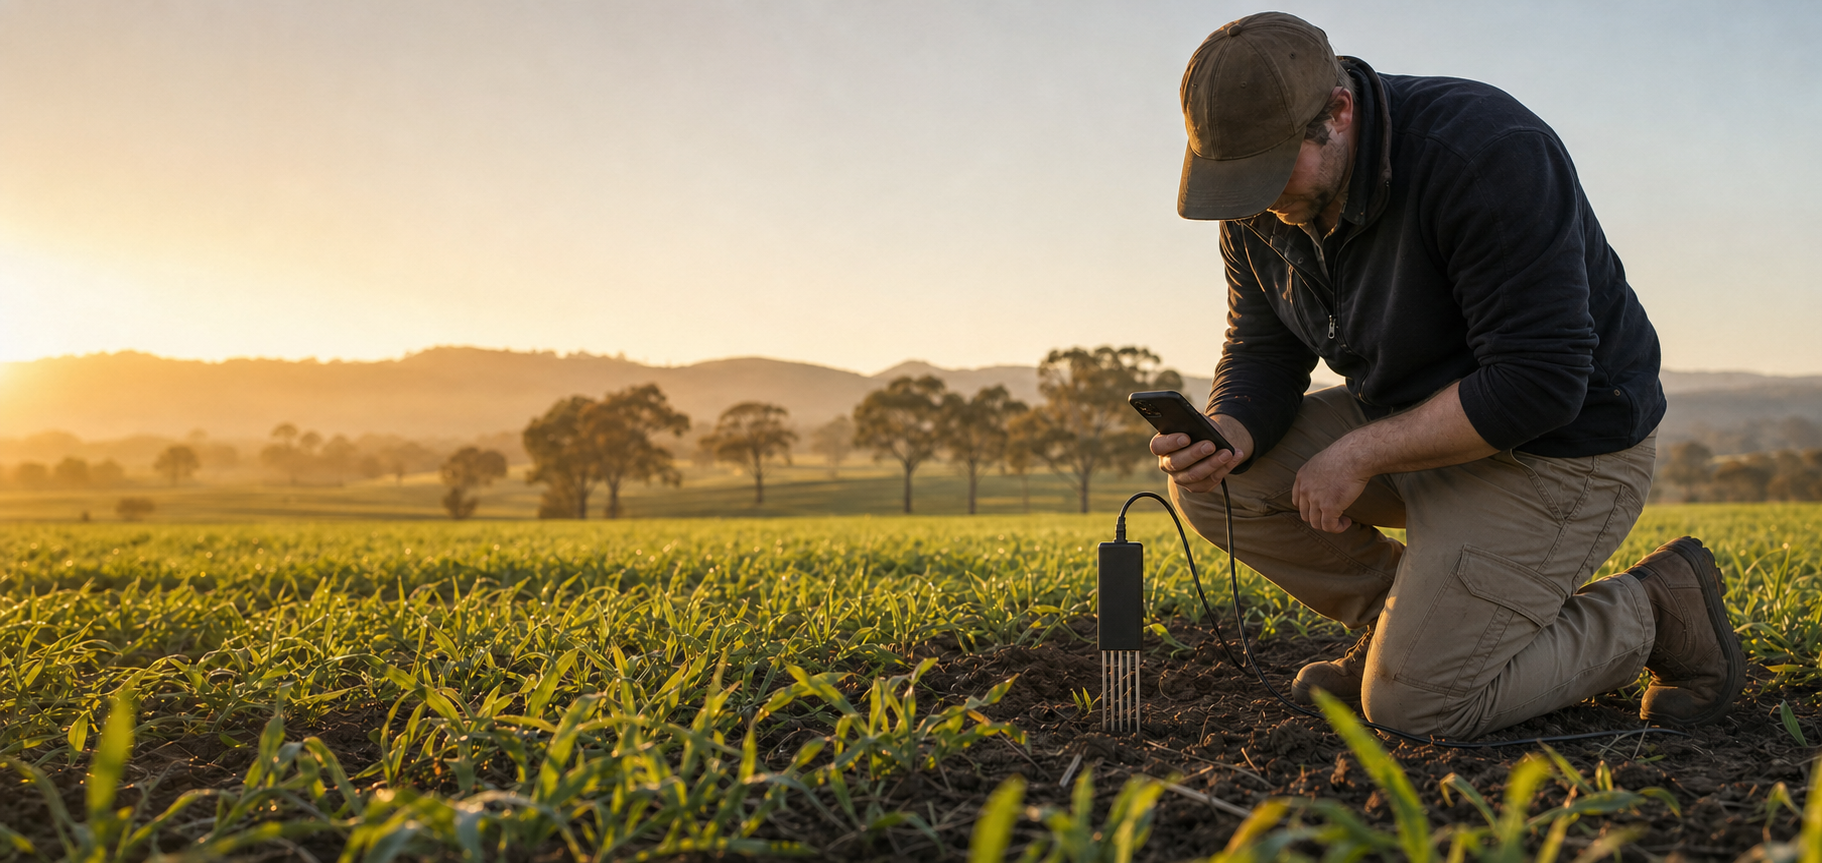
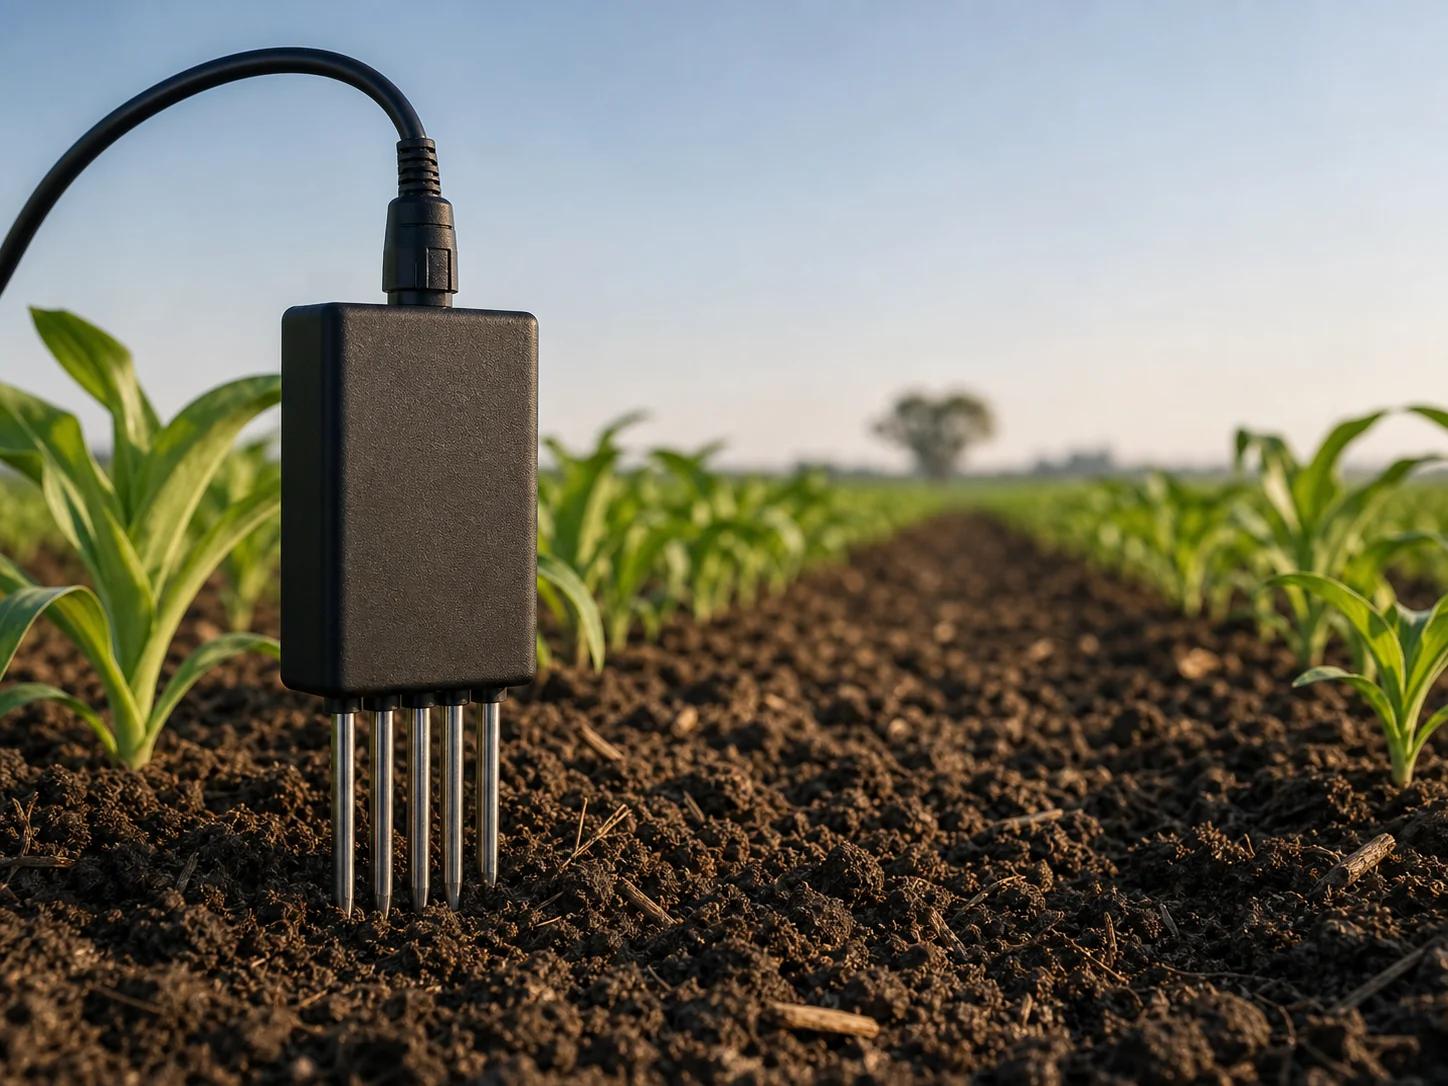
Measures moisture, conductivity and temperature in the paddock — the EC signal zone mapping already trusts — then saves a GPS farm record so lab money goes where variation is. Pair it with a penetrometer to log compaction at the same named points.
See the probeIn one insertion
Moisture, EC and temperature are measured directly. pH, N, P and K are indicative values calculated from conductivity. Tap each one for how it works and why it earns a place on the probe.
Moisture · % Measured
Measured directly. Specified to ±2% between 0 and 50% moisture, ±3% above that.
Moisture drives whether nutrients can move to roots, how plants cope between falls of rain, and whether a dry or wet spell is showing up in that paddock yet. Tracked at the same GPS point, it shows how the profile fills and empties across a season.
Is this paddock drying faster than the one next door? Did the last rain reach the depth I care about?
Measured directly by the probe. Comparable between visits when you sample at a similar depth and moisture.
Conductivity · µS/cm Measured
Measured directly, to ±3% of full scale. Needs soil moisture above about 20% to be meaningful.
Salts affect how hard roots work for water and can flag fertiliser residue or rising salinity. EC moves with moisture, so comparing readings at similar wetness — or watching the trend at one point — is more useful than a single number alone. It is also the measurement the pH, N, P and K screens are calculated from, which is why it repays attention.
Is EC climbing where I have been applying product? Does it fall after rain the way I expect?
Measured directly by the probe. Comparable between visits when you sample at a similar depth and moisture.
Temperature · °C Measured
Measured directly, to ±1°C.
Warmth and cold change microbial activity and how plants respond. Temperature also helps you interpret moisture and nutrient readings taken on different days. Saved with the sample, it stops you comparing a July reading to a January one as if they were the same conditions.
Am I sampling in comparable conditions? Has the profile warmed enough for the season I am planning around?
Measured directly by the probe. Comparable between visits when you sample at a similar depth and moisture.
pH Screened
Screened, not measured. This probe has no pH electrode — the value is calculated from the conductivity reading and reported across a 3–9 range. Treat a shift as a reason to book a laboratory pH test, not as a pH figure to act on.
pH sits underneath nutrient uptake, and when it drifts the same fertiliser program can look weaker without anything else changing. That makes it worth watching — but it also makes it worth measuring properly. A laboratory pH, reported against CaCl₂, is what a liming decision needs.
Has this corner moved since last season? Is that shift worth a lab suite?
Screened from the conductivity reading, not measured directly. pH, N, P and K are all calculated from that one measurement, so they rise and fall together — read them as a single signal about salts and fertility, not four independent results. Use accredited laboratory testing for any decision that needs a number.
Nitrogen · mg/kg Screened
Screened, not measured. Calculated from conductivity using a stored coefficient, so it responds to total dissolved salts rather than to nitrogen specifically.
Nitrogen is mobile and changes quickly with moisture, temperature and crop demand, which is exactly why a lab snapshot weeks later can miss what the paddock was doing. A screen is for seeing relative change and hotspots between points sampled the same day in the same soil — never for writing a rate.
Where does this look different across the paddock? Is the pattern worth chasing with proper chemistry?
Screened from the conductivity reading, not measured directly. pH, N, P and K are all calculated from that one measurement, so they rise and fall together — read them as a single signal about salts and fertility, not four independent results. Use accredited laboratory testing for any decision that needs a number.
Phosphorus · mg/kg Screened
Screened, not measured, from the same conductivity reading as N and K.
Phosphorus underpins root establishment and energy in the plant, and it moves slowly — so spatial differences persist. A low patch stays low unless you address it. Use the screen to decide where a targeted lab suite is worth paying for, rather than testing every hectare.
Is the low area the same place as last year? Is the variation worth a targeted lab suite?
Screened from the conductivity reading, not measured directly. pH, N, P and K are all calculated from that one measurement, so they rise and fall together — read them as a single signal about salts and fertility, not four independent results. Use accredited laboratory testing for any decision that needs a number.
Potassium · mg/kg Screened
Screened, not measured, from the same conductivity reading as N and P.
Potassium helps plants regulate water and respond to stress. Watching it at fixed points can show whether a paddock is drifting relative to its own history — but a portable reading is a lead, not a prescription.
Is this falling in the zones that work hardest through dry stretches? Does it track with stress I already notice?
Screened from the conductivity reading, not measured directly. pH, N, P and K are all calculated from that one measurement, so they rise and fall together — read them as a single signal about salts and fertility, not four independent results. Use accredited laboratory testing for any decision that needs a number.
Part two — the app
TerraTactics Field Intelligence (Android and iOS) pairs to your account with a one-time link code and holds readings locally until it can upload them.
Soil compaction
Compaction is physical context, not another chemistry indicator. Push a cone penetrometer, enter depth and resistance in PSI or kPa, and the app or portal keeps a GPS-tagged record you can compare with traffic lanes, stock camps and control areas.
Part three — the portal
Map your paddocks, review readings, compare across seasons, and get screening commentary that shows its working.
Draw each boundary once. Area is calculated, colours are yours, and every soil and compaction reading lands in the right place.
Filter by paddock, sample point and period, then chart any of the seven indicators against each other.
Deterministic commentary that quotes the values behind every observation and names the next responsible step.
On Grower you can download a spreadsheet of the readings you have filtered.
Optional — TerraTactics Soil Analysis
On Grower you can ask for a briefing of the readings you select. The rules are deliberate and strict.
Plans
For getting started on one or two paddocks
For a working farm across a full rotation
14-day trial, cancel any time.
For independent agronomists sampling client farms
14-day trial, cancel any time.
Ready to start
The probe, the app and the portal are designed to work together — start with either.